Edge Network Intelligence - An AIOps solution to monitor end user and IoT performance
VMware Edge Network Intelligence (ENI) is a vendor agnostic Artificial intelligence (AI) and Machine Learning (ML) solution that ensures end user and IoT (Internet of Things) client performance, security and self-healing through wireless and wired LAN, SD-WAN and Secure Access Service Edge (SASE). The product Edge Network Intellige (ENI) came to VMware with the Nyansa acquisition in January 2020. The product is available with SD-WAN and SASE (Secure Access Service Edge) or as a standalone deployment. It is a end-to-end monitoring and troubleshooting solution.
What makes ENI unique?
Most of the companies today have several monitoring and troubleshooting tools. A lot of management tools are vendor specific, unflexible and not user focused. Silos between compute, network, storage and security teams make it more difficult. Finger pointing in case of performance issues is not an exception. Often it is not possible to install a management agent to IoT devices due to regulation restrictions. All this makes it time consuming, costly and reactive.
Edge Network Intelligence collects data from the end device, application and network which includes client, LAN, WAN, Wireless, Firewalls and applications (see picture 1). ENI provides following features:
Analyzes every wired and wireless user transaction
Proactive monitoring from user and device incidents
Benchmarking
Displays user performance before and after a network change
Root cause analytics for user and network problems
Site by site user experience comparisions
IoT device monitoring
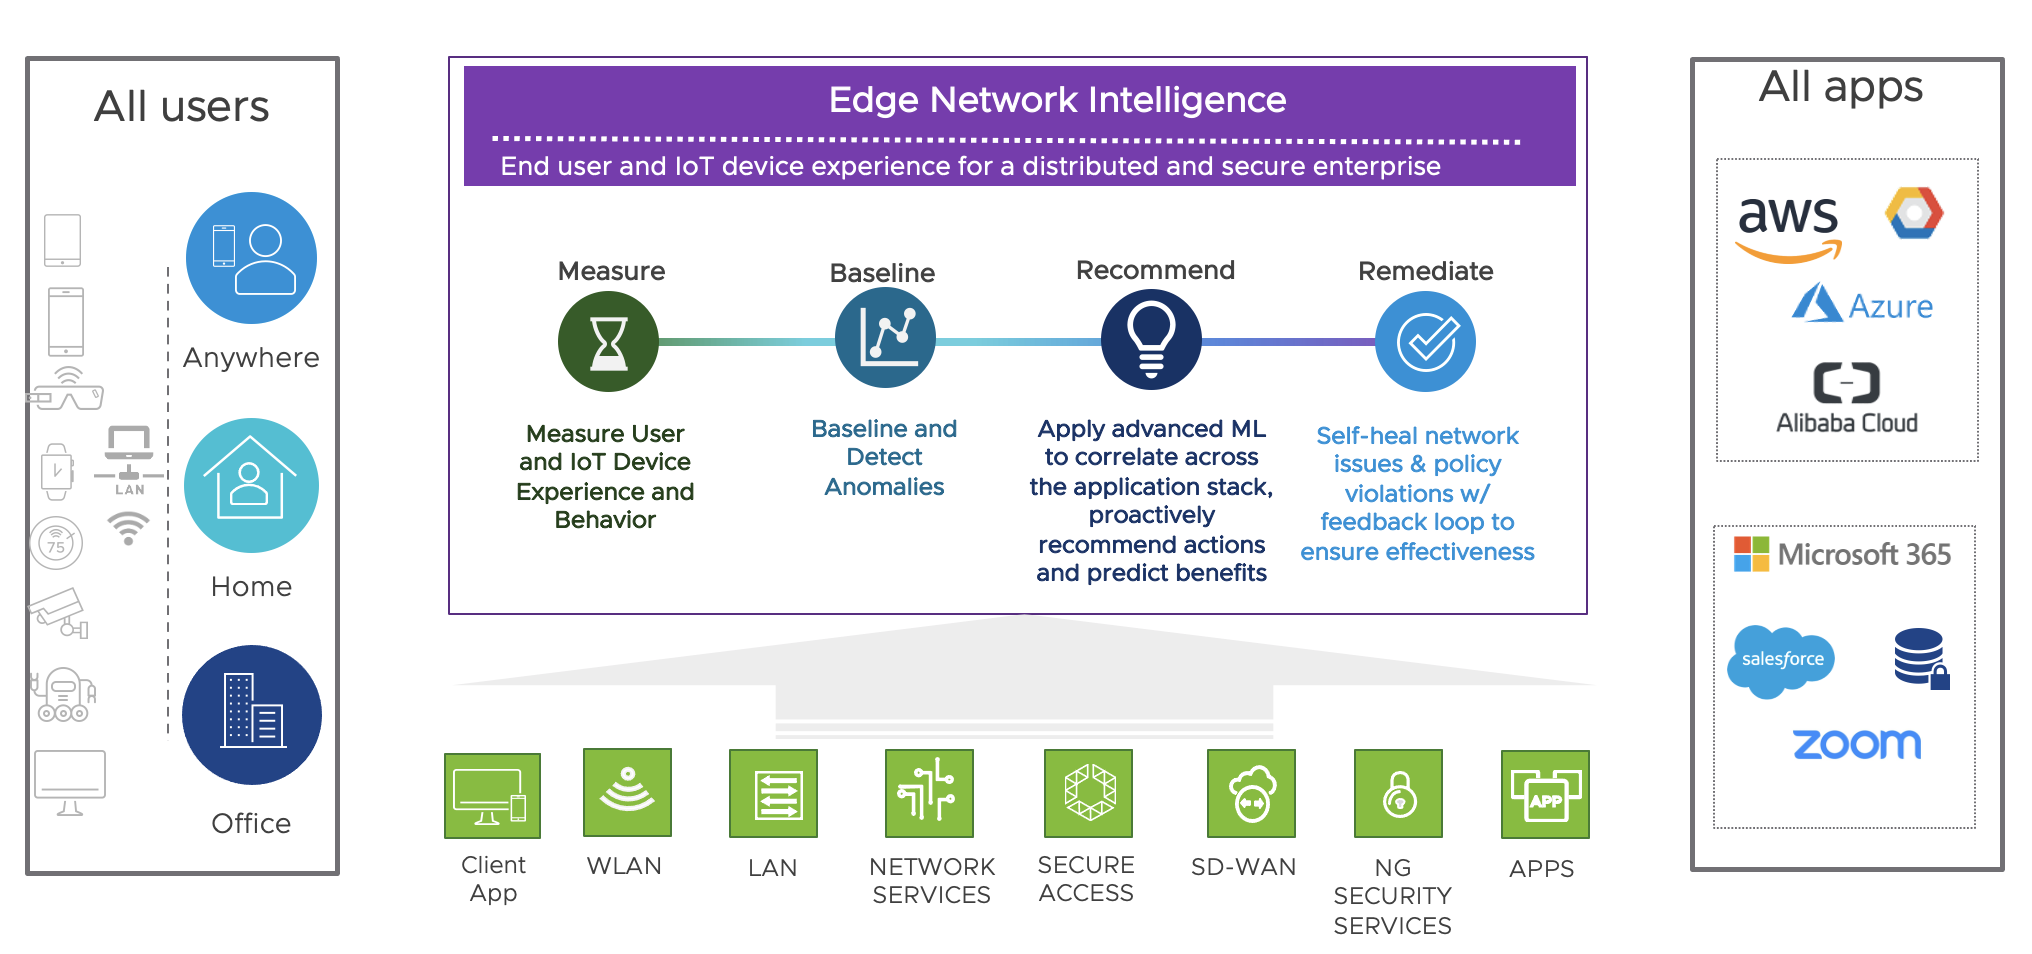
Picture 1: Edge Network Intelligence (ENI) Overview
How is ENI designed?
Initially ENI measures user and IoT device experience and behavior. The system creates a baseline with this inputs and detects anomalies if outliers take place. As a next step proactively recommendations and predict benefits will be created based on machine learning to correlate across the application stack. Finally remediation will be realized with self-healing networking and policy violations feedback. With this design the system provides deep insights and analytics function for whole customer environments with a end-to-end monitoring solution.
ENI is quiet simple to understand and useable. On the left sidebar there are the areas Dashboards, Incidents, Analysis, Inventory, Report Management and dedicated account setttings visible.
Dashboards
From default there is the dashboard “summary” (see picture 2) and the dashboard “Global” (see picture 3) available. The dashboard “summary” shows informations about the top 5 applications issues and the the top 5 application traffic utilization. It is always possible to zoom in to get more details. Advisories, problematic clients and WI-FI Health by group round up the “summary” dashboard. The dashoards are showing live datas.

Picture 2: Dashboard - Summary
The “global” dashoard (see picture 3) provides a nice grahical overview with a incidents and performance sidebar. From this starting point it is possible to click to dedicated sites or to jump in special problems, i.e. on site “Newcastle” 44 % are Wi-Fi Affected. Next step could be to check the “Newcastle” dashboard if there is a outage of a wireless controller or any other problems.

Picture 3: Dashboard - Global
Service Desk Feature
Other good opportunity to fix an user problem is the “service desk” option. The troubleshooting can be started with device username, IP addresses, hostname or MAC address. After the time range is specified it can be selected what problem has been reported, like Network is Slow, Internet Connection Dropped, Can`t Connect to Wi-Fi, Wi-Fi Disconnecting, Poor/Weak Wi-FI, Poor Video Conference, Application Trouble or other items. Afterwards the system provides indications if the issue is related to a know problem.

Picture 4: Service Desk - Step 1

Picture 5: Service Desk - Step 2
Incidents
Under the incidents view (see picture 6) the severity is structured in P1 (critical), P2 (High), P3 (Medium) or P4 (Low). There is a option to filter per priority or via type. Some problems are visible under more than one type, i.e. Client has poor Wi-FI performance can be shown under type application and type WI-FI. The time range can be changed in the top right corner.

Picture 6: Incidents view
After a dedicated problem is choosen there are more details visible (see picture 7). On the timeline map the baseline is compared to the issue. Incident summary, potential root causes, next steps, affected clients, symptoms, top client properties and client properties provides a lot of valuable input to fix the outage. The graphs under client properties are shown more specific parameters, like Access Points Groups, Gateway, OS, Model, DHCP Server, Acceess Point and VLAN ID.

Picture 7: Troubleshooting from a dedicated problem
Analysis
Analysis can be done from Network History, Benmarks or Health Remediation point of view.
In the dashboard Network History there is a timeline which shows how many user are affected. This can be sorted by different metrics, like Client Web performance, Clients not connecting to DNS, etc. The purple line is the indication about a change which has been realized in the evironment. The time period can be also changed in the right top corner.

Picture 8: Network History view
Special dashboards for industry and internal benchmarking are also availalbe in the system.
Health & Remediations
The Health & Remediations view is very useful to check reported user problems like “WebEx is slow”. A metric can be choosen to investigate which clients, access points and custom groups are affected.

Picture 9: Health and Remediations view
Inventory
The inventory field is also a very good feature. Especially for the IoT devices it is very useful to get input about devices types, OS, IP addresses, MAC addresses, hostname, category, application, access points, switches, VLANs, servers, etc. For medical devices as an example, device information like infusion pump or a Compute Tomograph (CT), OS system, which protocols are used, IP addresses, MAC addresses, etc. are shown.
Reports can be also created with different metrics. The reports can be done directly generated or scheduled.
Summary
Edge Network Intelligence (ENI) is a nice and easy way to monitor and troubleshoot end user and IoT client problems. The main advantage is that the system is designed to troubleshoot from user point of view, i.e. search in the system for “WebEx is slow”. You can get the solution with VMware SD-WAN, SASE or as standalone. If you want to check it out for free go to https://sase.vmware.com/products/edge-network-intelligence/edge-network-intelligence-demo.